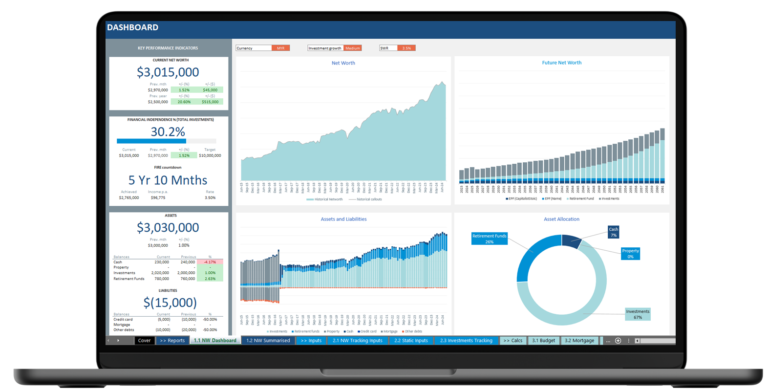
In my previous post about building your own financial model, you would have seen that for some of the input data, the numbers that you would use can be quite subjective. For example, what rate of return should you use for investing in stocks, or what inflation rate should you use for regular expenses?
This post will look into the art of using assumptions figures that suits your circumstances (note I didn’t say the right or accurate numbers, as there is no right or wrong).
What you will learn in this post
This is a continuation of my financial planning series that is aimed to help you to set your goals, develop a financial plan and execute it.
You will learn about
- What is an assumption in financial modelling
- The key assumptions in a personal financial model
- Other assumptions that you need to think about
- What are reasonable input figures for each assumption
- How to increase your confidence in estimating assumptions
- More advanced assumptions to consider
What is a financial assumption?
First, let us look at a definition of an assumption. According to the Cambridge dictionary, an assumption is:
something that you accept as true without question or proof
So this means that anything that YOU can accept as true can be an assumption. What this means is, if you believe that inflation will be 10% over the next 20 years, that is your assumption. It may not be what eventually becomes true, but your (hopefully reasonable and logical) estimate.
What are financial assumptions in a personal financial model?
The quick answer is, assumptions in a personal financial model are data inputs which are not “an actual fact”, but an estimate or prediction what you might think could happen to your income, expenses, savings and investments.
Examples of actual facts and NOT assumptions
- Your bank account balance
- The stocks you own
- How much income you earned last year
- How much you pay for rent this year
Example of assumptions in a personal financial model
Most of the time, I’d categorize the different assumptions into 2 main buckets:
- Percentage Rate assumptions, which generally fall into:
- Inflation rates: General expenses, education and medical typically increase at different rates over time. Ever notice how much college and university fees have increased so much more than food staples? Let’s not even get started on the exponential rise of medical bills
- Investment rates of return: Rate of return based on each asset class, such as fixed income, property, equity, etc.
- Loan interest rates: Typically your home mortgage rates, car loan rates, or even personal and credit card interest rates
- Changes to income: How much you think your salary might increase every year (although you could also estimate this by salary bumps you get every few years from switching jobs or promotions)
- Expenditure assumptions, which are generally what you think you’ll spend in the future, such as
- Car(s): How much would the price be for any car purchases in the future
- Housing: The purchase price of any future property purchases, or rental expenses
- Raising children: These costs can be highly subjective based on how much you’d spend for groceries, diapers, eating out, etc. for the rest of their dependant lives
- Children’s schooling/university fees: These costs can also vary greatly. Public school and private school costs be very different, especially over the cost of say 15 – 18 years
- Vacations: How much do you want to spend? How luxurious and expensive are your holiday destinations and associated activities?
- Medical/hospital bills: These costs can be highly subjective. You might want to include a good safety buffer of savings that insurance might not cover, based on your family medical history
In the next section I’ll cover what are reasonable figures to use for rate assumptions. Expenditure assumptions I hope doesn’t need any further explanation, it really is based on your SMART goals.
Developing reasonable estimates for rate assumptions
The most common way to identify what numbers to use for inflation rates, investment return rates, etc. would be by analyzing historical figures. The easiest number to use would be to use the historical average.
Now you might say, past performance is not an indicator of future returns. Which is generally true. However, the average performance of an asset has generally been quite accurate over extended (really long) timeframes. In the past 100 years, we have observed many global wars, pandemics, exponential innovation and growth, and financial crises. So if we analyse rates over a long timeframe, it will provide a reasonable level of confidence of what an average rate might over the future long term.
Can you accept that to be true as an assumption? I can.
Let’s try to analyze what the future investment returns might be for equities or an index fund, using the S&P500 as a benchmark.
Luckily, Aswath Damodaran (well known corporate finance professor and market commentator) has collected the historical returns for the past 100 years of the S&P 500 and many other asset classes in the US.
The annual returns of the S&P500 including dividends is shown below:
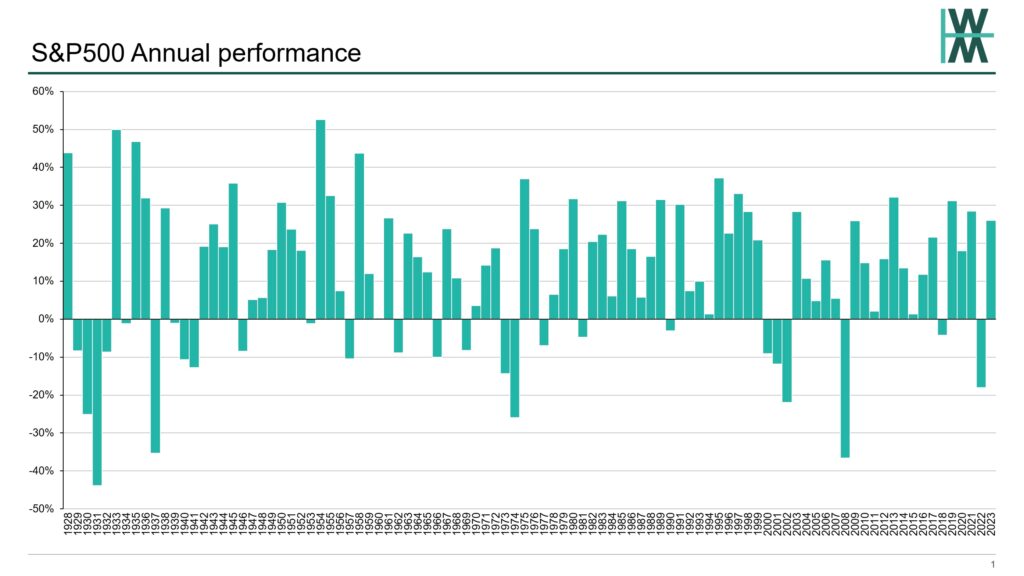
Do the negative returns look scary to you? Any one year, the S&P500 could drop up more than 40%, or be up 50%! What’s the average over the 100 years? 12% returns.
Could you use 12% as a reasonable assumption for your investments? If you’re thinking of investing for only 1-2 years, I wouldn’t have any confidence. There’s too much variability in what the returns might be.
What if we looked at what the annualized returns look like if we held the S&P 500 over say, 5 years? Well, the chart below shows what that might look like (for example, the last bar at year 2023, the annualized returns over 2019, 2020, 2021, 2022 and 2023 was about 17%).
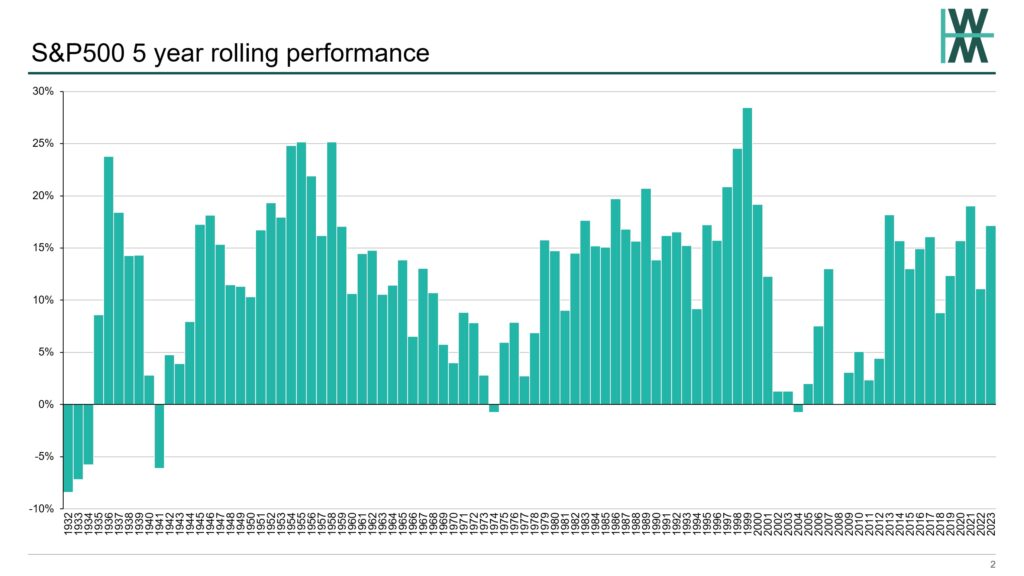
Overall, the numbers are looking better right? Very little 5 year periods in the past 100 years where you would have lost money.
How about over 10 year periods?
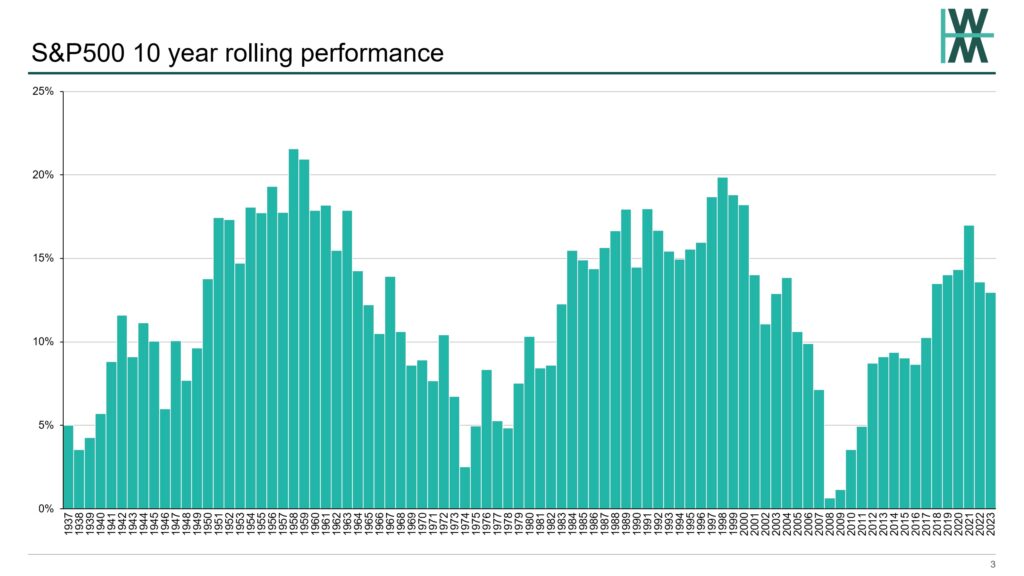
Getting better! What about 20 years?
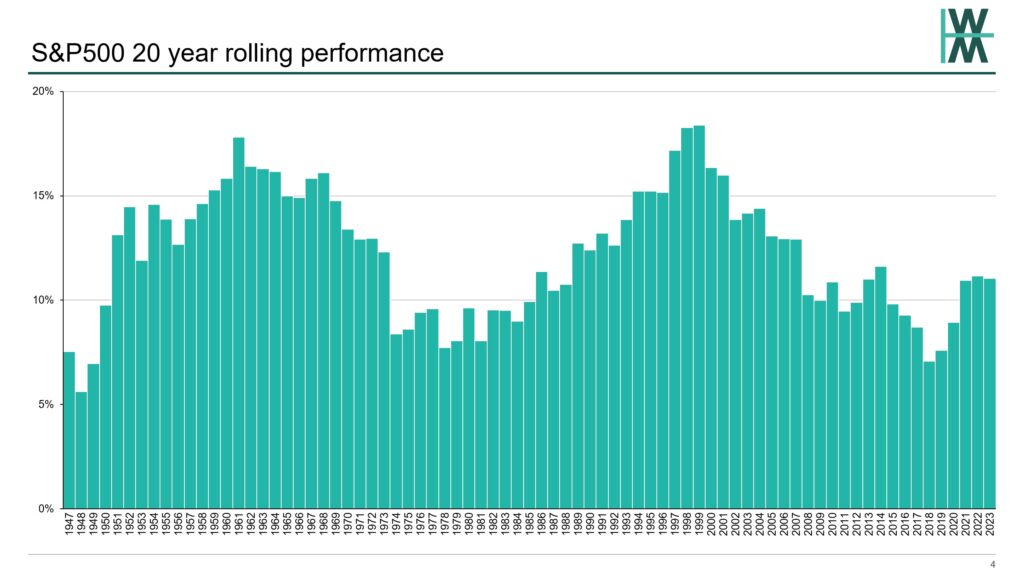
The lowest return was just over 5%!
How about 30 years?
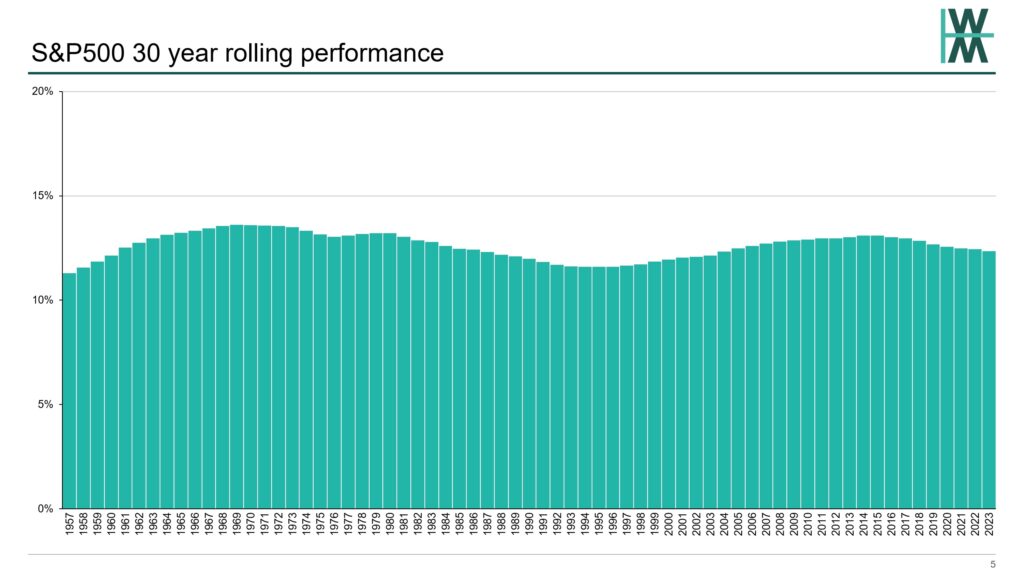
All results are really close to the overall average of 12%!
So, we could use 12% as our assumption for the investment return rate if you would invest in the S&P500 over a relatively long time period. A few important notes
- Investment holding timeframe matters. For a lot of your financial modelling, you’d assume that you wouldn’t be selling your equities / etfs / unit trusts anytime soon, and it’s mainly used for things decades in the future such as your retirement or children’s education, not as a place to save funds to buy a car next year (that would be crazy)
- If you’re investing in different market or asset types, you need to find historical data for that specific market (or closest comparable), as long as there’s data spanning decades
Now, in the table below, I show the calculations I’ve done for different asset classes available from Aswath Damodaran’s data. I also show the returns 1 standard deviation above /below the average. This gives an indication of the volatility / or potential variability of return rates over different holding periods (for more on standard deviation, see here)
S&P 500
| 1 Year | 5 Years | 10 Years | 20 Years | 30 Year | |
| -1 Std Dev | -7.8% | 4.2% | 7.0% | 9.2% | 12.0% |
| Avg | 11.7% | 11.8% | 12.0% | 12.2% | 12.6% |
| +1 Std Dev | 31.1% | 19.4% | 16.9% | 15.2% | 13.2% |
Real Estate
| 1 Year | 5 Years | 10 Years | 20 Years | 30 Year | |
| -1 Std Dev | -1.8% | 0.0% | 1.6% | 3.5% | 4.6% |
| Avg | 4.4% | 4.5% | 4.6% | 4.9% | 5.0% |
| +1 Std Dev | 10.6% | 8.9% | 7.6% | 6.2% | 5.4% |
Baa rated Corporate Bonds
| 1 Year | 5 Years | 10 Years | 20 Years | 30 Year | |
| -1 Std Dev | -0.7% | 3.2% | 3.9% | 4.2% | 4.4% |
| Avg | 7.0% | 7.2% | 7.3% | 7.3% | 6.8% |
| +1 Std Dev | 14.6% | 11.3% | 10.7% | 10.3% | 9.2% |
US Treasury 10-Year bonds
| 1 Year | 5 Years | 10 Years | 20 Years | 30 Year | |
| -1 Std Dev | -3.1% | 1.3% | 2.0% | 2.5% | 2.5% |
| Avg | 4.9% | 5.1% | 5.2% | 5.4% | 5.0% |
| +1 Std Dev | 12.8% | 8.9% | 8.5% | 8.3% | 7.5% |
US 3-Month Treasury Bills
| 1 Year | 5 Years | 10 Years | 20 Years | 30 Year | |
| -1 Std Dev | 0.3% | 0.5% | 0.7% | 1.4% | 1.8% |
| Avg | 3.3% | 3.4% | 3.5% | 3.8% | 3.9% |
| +1 Std Dev | 6.3% | 6.2% | 6.2% | 6.2% | 5.9% |
Gold
| 1 Year | 5 Years | 10 Years | 20 Years | 30 Year | |
| -1 Std Dev | -14.1% | -4.6% | -2.6% | 0.5% | 2.4% |
| Avg | 6.6% | 6.7% | 6.6% | 6.8% | 6.3% |
| +1 Std Dev | 27.2% | 18.0% | 15.7% | 13.0% | 10.2% |
You’ll notice from the tables that the principle of investment returns being proportional to risk is generally true, and investment risks are typically depicted in the form of volatility.
From the analysis above, the reasonable growth rates you could use in your personal financial model would be:
- Equities/funds: 12%
- Corporate bonds: 7%
- Real estate: 5%
- Government 10 year bonds: 5%
- Goverment 3 month treasury bills: 4%
- Gold: 6%
How different rates used in assumptions can dramatically affect outcomes
Over long periods of time, small differences in rate assumptions can change outcomes significantly.
Using our personal financial model, let’s look at how a difference of 2% in the investment returns of a retirement fund can impact the end result:
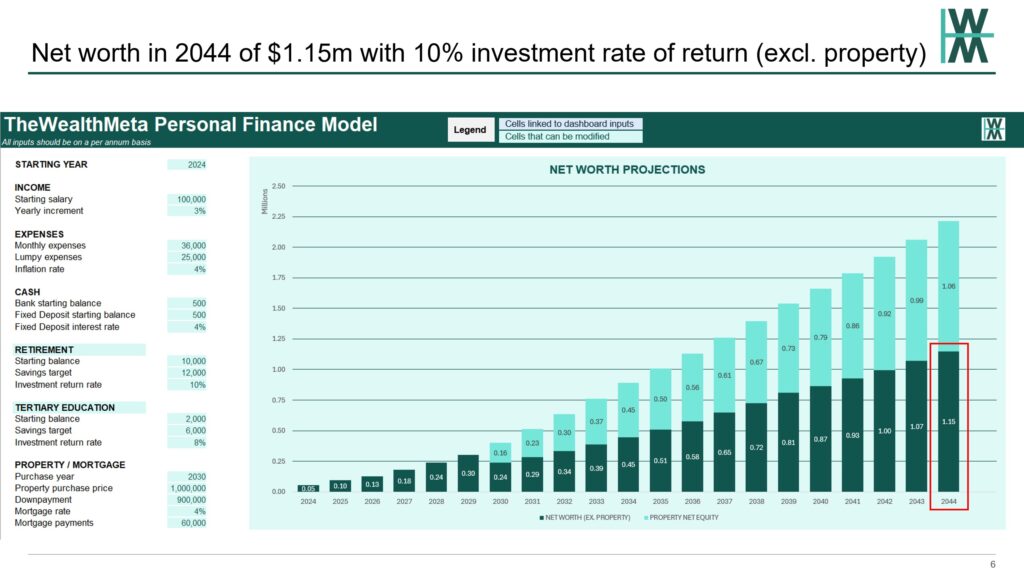
Let’s compare the 10% returns above with 12%, below:
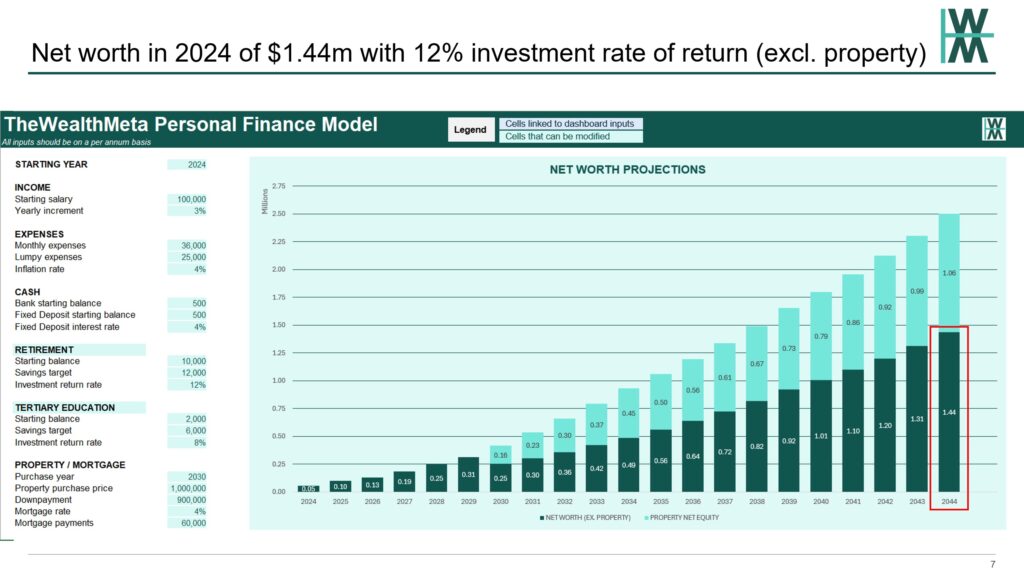
Based on saving $12k a year, over 20 years the difference is almost $300k!
Now can you see why you need think twice before allowing active fund managers to charge you 1-2% in management fees?
The longer the time period you project, the more substantial the difference in using different assumption figures.
Frequently Asked Questions
What numbers do you use for expense rates, such as general, education and medical inflation rates?
- Inflation rates: A decent range might be somewhere between 2.5-3%. This is normally the range which many central / reserve banks like to target. I like 3%. If you want to be really conservative, do 3.5%
- Education inflation rate: I recommend doing a bit of research schools you’re targeting for your kids. Many private/international school and university fees are published online, even previous year’s fees. In Malaysia where I’m currently based, it’s about 3-5%
- Medical inflation and expenses: This is extremely hard to estimate. Who know what medical conditions you might get in the future? Also, medical costs has been rising in many countries at crazy high rates. I can only say the best thing to do is to try to absorb as much of it through insurance premiums, project the future cost of premiums and add a nice big buffer on how much the premiums could increase to in your old age.
These numbers seem too high or low!
They’re based on historical facts. If you’re comparing it with a similar investment outside of the US, then you have to consider the local market dynamics which would shift the numbers a bit. Adjust accordingly
How can I be sure these numbers are accurate?
You can’t. That’s why they’re assumptions. It’s what you can accept to be true. Models are meant to give directional feedback to help make decisions (and to understand which assumptions affect outcomes the most, as a secondary objective)
What you could do is to analyze/input a range of figures. You will then understand how different assumption rates or figures will result in different projections of your financial situation.
This is also called scenario analysis, a common practice in modelling.
If you’re experienced in Excel, you’d have an idea how to create “switches” or “toggles” using drop down lists to quickly choose between different scenarios to see the effects.
Usually, in a model, the most basic scenarios would project 3 different scenarios; a low, medium/base and high case. More complex scenarios can have more scenarios, or you may want to look into how to perform a sensitivity analysis.
For the usual 3 scenario analysis, using investment rates as an example, could use 8% as the low case, 10% as medium/base and 12% as the high case.
What else can I do to minimise underestimating how much I need to save/invest, or minimise risks of being too optimistic in my projections?
- Include a bigger margin of error/buffers in how much your expenses and goals cost
- Be conservative in the assumption figures you use
- Overestimate inflation and expense increases. Don’t forget lifestyle creep/inflation
- Don’t project that you will receive promotions or large pay bumps
- Include scenarios where you might end up with extra dependants than you intend (you never know how much you need to support aging parents, or you might get a surprise in the form of twins!!!)
Conclusion
I hope this post gives you some confidence on how to analyze your personal financial model using different assumption figures.
Thus far I have given you the information to create SMART financial goals, a budget, and a personal finance model which you can use to help plan your future. It’s a lot to take in, and requires a lot of effort. But your financial independence is worth it, right?
I’ll take a short hiatus from writing specifically about financial planning, and cover a few other topics before I go deeper into financial planning as part of “phase 2”.
Stay tuned.


